Alert on Candle CloseAlert on Candle Close is a simple indicator allowing you to set alerts when a candlestick closes.
Instructions for use
From the chart window, click on "Indicators" and search for "Alert on Candle Close".
Click on "Alert on Candle Close" to add the indicator to your chart. Click on the star icon to add it to your favourites to easily access later.
Set your chart timeframe to the timeframe you wish to alert on. For example, to create an alert when a 4h candlestick closes, set your chart to the "4h" timeframe.
Hover over the "Alert on Candle Close" indicator which has been added to your chart and click the ellipsis "..." icon, then click "Add alert on Alert on Candle Close" or use the keyboard shortcut "Alt+A" from the chart.
In the alert pop-up window, make sure "Condition" is set to "Alert on Candle Close" and "Trigger" is set to "Once Per Bar".
Optionally, you can set a custom expiry for the alert, give the alert a name and customise the alert message. You can configure notification settings from the "Notifications" tab.
Click "Create" and your alert is set up!
Each alert is tied to the timeframe and chart it was created on, so you can change the timeframe or asset and create more alerts by repeating the above process.
Note : this indicator is only designed to work with time-based chart types, such as Bars, Candles or Heikin Ashi. It will not work for non-time charts such as Renko.
FAQs
Why do my alerts sometimes not fire as soon as the candle closes?
This is a limitation with Pine Script's execution model. Indicators are calculated whenever a price or volume change occurs i.e. when a new trade happens. For illiquid or slow moving markets, there may be some time between when a candle closes and the next trade, leading to a delay in the alert triggering. The alert will trigger on the next tick of data on the chart.
Why can't I create more alerts?
TradingView has a limit on the number of active technical alerts you can have based on your membership tier. To configure more alerts, consider upgrading your TradingView plan to a higher tier. See a comparison of TradingView plans at www.tradingview.com
My alert only fired once, how can I get it to keep working?
When configuring the alert in the alert pop-up window, make sure you set "Trigger" to "Once Per Bar" and "Expiration" to "Open-ended alert".
在腳本中搜尋"Heikin Ashi"

MrBS:Directional Movement Index [Trend Friend]I started this project with the goal of making a DMI/ADX that was easy to read at a glance. Its since become a little more then just colouring the slopes. The majority of the time, the best returns come from trending markets (THE TREND IS YOUR FRIEND... until the end) and I hope this helps people become good friends with the trends.
----- Features
- A function to change the values used for calculation from real OHLC and Heikin Ashi. This allows us to look at different chart types but see the specific ADX we choose. Originally HA values were used for calculation since it is easier to see trend on HA charts. However when testing it was not as effective as the ADX calculated from the real values on normal charts. So the default function was flipped and real OHLC values are used as default.
- Two ADX plots so we can see two different smoothness's. With a smoothing of 2, a slight slow down in PA can cause a negative slope but the smoother ADX will stay trending unless its a major change. 2nd ADX is slightly transparent.
- There is an EMA of the main ADX that can be used as a exit signal filter. If the ADX starts going down but has not crossed the EMA we would stay in a trade.
- Plots (excluding EMA) are coloured based on positive or negative slopes.
- Fibonacci numbers have been used to create different trend levels, instead of the standard 25, 50, 100.
- Alerts for every useful situation to help save time and not have to manually enter levels or crosses each time.
- In the code there are 8 EMAs and 3 ADXs but it was too much so they have been slashed out, but are fully functional if you choose to activate and use them. To reactivate the 3rd ADX delete slashes on lines 50, 65, 78, 92-95, 165. The slashed out EMAs are much more obvious and easy to reactivate.
Colours:
ADX going up = Green
ADX going down = Red
DMI+ going up = Bright Aqua
DMI+ going down = Turquoise / Dark Aqua
DMI- going up = Bright Purple
DMI- going down = Dark Purple
EMA = White (50% transparent)
If there is anything that would be useful, let me know and I will add it in. I've already got some improvements/changes planned and some of my notes can be found in the code.
There is also a strategy to go with this indicator that will be uploaded very soon.

Dr. Keith Wade Momentum SignalsThis is a heikin Ashli strategy combined with an 18 moving average crossover. Entry at cross of 18 EMA and exit at change of heikin Ashi

Pivot Points with MID LevelsThis indicator shows the Standard Pivot Points level based on daily values that can act as support and resistance. It is used by a variety of traders around the world. You can select which time frame Pivot Point Levels you'd like. Daily, weekly etc... Perfect for swing trading or day trading.
Pivot Points- Shows 3 levels of resistance, the Pivot Point and 3 levels of support
(R3, R2, R1, PIVOT POINT, S1, S2, S3
MID Levels- The MID levels are 50% retracement from the pivot point level above it and below
Example- R3, MID, R2, MID, R1, MID, PIVOT POINT, MID, S1, MID, S2, MID, S3
With this indicator you will also have the option to show the Previous days High and Low that are also important levels. On gap up/down days it is always interesting to see if price will close the gap, hence the important level to note.
PDH= Previous Days High
PDL= Previous Days Low
I have added a feature that you can now select specific color to each level and the line style for each level to help understand which levels are being show by personal needs.
Happy Trading

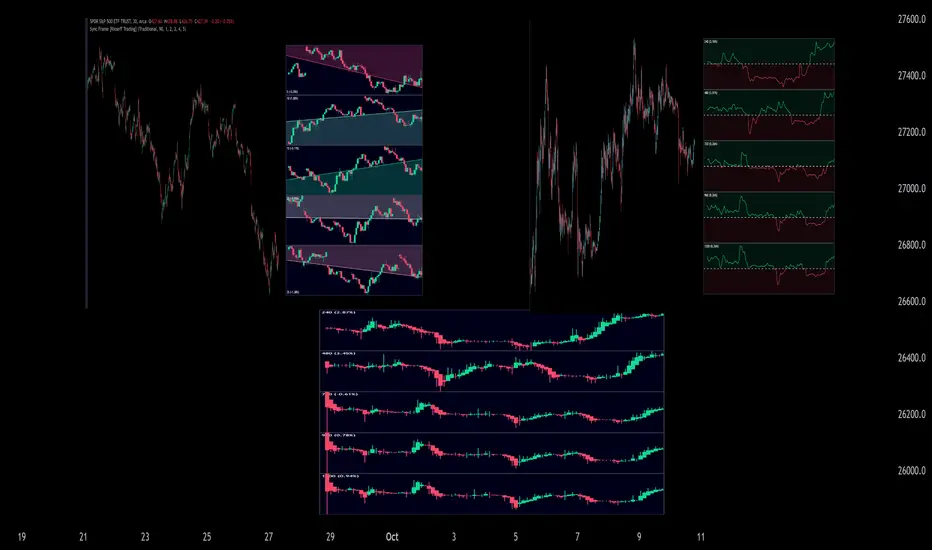
Sync Frame (MTF Charts) [Kioseff Trading]Hello!
This indicator "Sync Frame" displays various lower timeframe charts for the asset on your screen!
5 lower timeframe candle charts shown
Timeframes auto-calculated using the new timeframe.from_seconds() function
Heikin-Ashi candles available
Baseline chart type available
Dynamic Scaling for ease of use
User customizable timeframes
Simple script (:
The image above shows the baseline chart type.
Time image above shows a traditional candlestick chart.
The image above shows a hekin-ashi chart.
The image above shows the indicator when nearly zoomed in as much as possible. The lower timeframe charts adjust to my chart positioning.
The image above shows my screen fully zoomed out; the lower timeframe charts adjust in both height and width to accommodate my chart positioning!
Thank you for checking this out (:
Heinkin-Ashi Shadow Candles// Public Domain
// By JollyWizard
// For overlaying Heikin Ashi candles over basic charts, or for use in it's own panel as an oscillator.
// Enjoy the visual cues of HA candles, without giving up price action awareness.
// Good for learning and comparison.

BarbwireThis indicator looks for where market momentum is waning.
It uses Heikin-Ahi for that.
Heikin-Ashi averages the Open and Close prices, so the entity is not compressed as often as candles.
Using this characteristic, the continued compression of the entity is indicated as a decline in the market.
Settings:
Period - The degree of compression is calculated as a stochastic-like percentage. Specify the period to be used for the calculation.
Level (%) - If it is smaller than this number, it is assumed to be compressed.
Minimum period - The agreement shall be valid if it has been continued for at least this period.

MACD Trend CandlesThe script combines 2 indicators (MACD and Stoch-RSI) and puts them visually directly on the candles - can be used with normal OHLC candles or Heiken Ashi candles. Furthermore, you can derive divergences exremely easy directly visually from the candles as well. Lastly, a SMA 20 high and a SMA 20 low line build a trend channel.
Script is best used in trending markets to trade with the trend.
1) SMA trend channel:
* uptrend: close above
* downtrend: close below
* aggressive entry (uptrend) closing inside channel from below
* conservative entry (uptrend) closing above channel from inside
* hold (uptrend) until close below channel
* can be used accordingly for the downtrend
2) MACD candles
* visualization of the MACD histogram directly on the candles
* dark blue: histogram > 0 and histogram > histogram of previous candle
* light blue: histogram > 0 and histogram < histogram of previous candle
* orange: histogram < 0 and histogram < histogram of previous candle
* light blue: histogram < 0 and histogram > histogram of previous candle
* hold uptrend (dark/light blue candles) - combined with trend channel (above channel)
* hold downtrend (orange /yellow candles) - combined with trend channel (below channel)
* Color divergence: light blue candle > dark blue candle (price and MACD show divergence (bearish)
* Color divergence: yellow candle < orange candle (price and MACD show divergence (bullish)
* Trend change (0 line cross to upside) yellow or orange to dark blue
* Trend change (0 line cross to downside) dark or light blue to orange
3) Stoch RSI diamonds
* visualization of the STOCH-RSI as diamonds above or below the candle
* k, d line > 80: diamond above the candle
* k, d line < 20: diamond below the candle
* divergence caldle without diamond above > candle with diamond above (bearish divergence)
* divergence caldle without diamond below < candle with diamond below (bullish divergence)
Feel free to test each part individually and combine it with other indicators, e.g. BBands and Ichimoku Cloud - you will see it is a powerful visualization script
HAVE FUN

CSRS v2Candlesticked RSI v2 for price action traders!
See the True Momentum.
6 chart type, smooth RSI , add signal lines, find divergences, special alerts
This is 2nd version with major upgrade
Improved and more powerful
fully customizable.
features:
See RSI in 6 type of chart(Candles, Hollow Candles, Siwi Candles, Heikin Ashi, HL Bar, Line)
Monitor Up to 3 RSI , each one at desired resolution, source and length
Smooth each one of chart separately to remove noises
Add up to 3 signal line to primary chart in your desired source and type( SMA , EMA , WMA , HMA )
Find divergences which has special parameters
Gradient color adjustment of line chart
Add alert for reaching to important levels and detected divergences

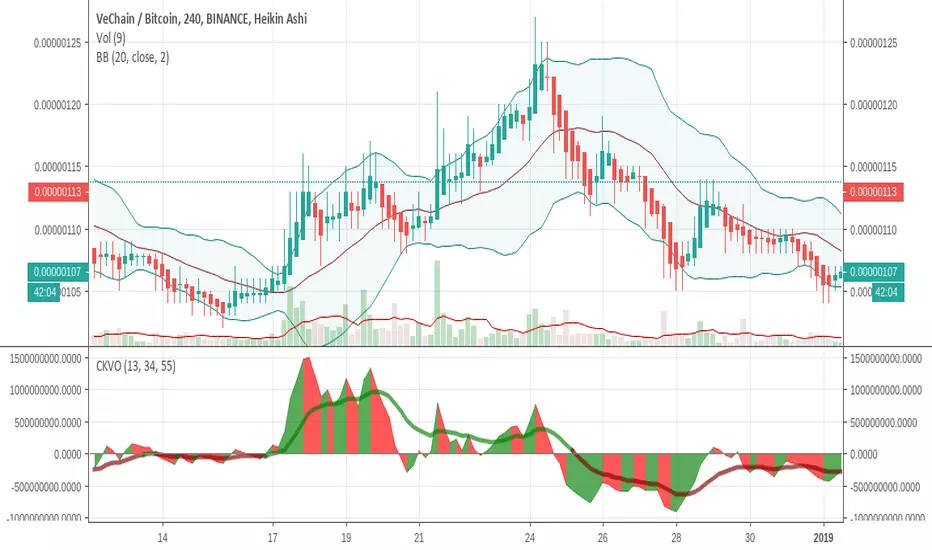
Colored Klinger Volume Oscillator (CKVO)This is a color enhanced version of Klinger Volume Oscillator. I specially designed this to get maximum profit from highly volatile coins. This indicator is based on volume.
xTrigger (the line) shows if trend is bullish or bearish. It is the average of the area. You can clearly see the trend.
xKVO (the area) shows how buy and sell orders change. It rises while buys are increasing against sells, decreases while sells are increasing against buys.
The color or the area provides buy and sell signals. Green: buy. Red: sell. Gray: Undecided.
Of course there are false signals. You should use other indicators to confirm them.
I like to use RSI and Bollinger Bands along with it to eliminate false signals. Also check for double bottom and top, etc.
Its wise to check the general direction of coin using a bigger time frame using Heikin Aishi. For example 1W Heikin Ashi if you are trading on 1D.
In addition to buy signals the most important indication is divergence with the price. Before a trend change 2 kinds of divergences happen
- Trend line moves reverse to the price line
- Are a tops moves revers to the price tops. For example while there is a higher price top, there is a lower area top. Then its time to escape.
Motivation
It is common to suffer from failures while trading highly profitable but volatile coins like NULLS, REP, DLT, LRC, MFT, HOT, OAX, KEY, etc.
- Traders sell too early to ensure a profit. Sell at 10% and it goes 200%
- Traders buy too early. Traders buy and it drops yet another 50%
- Wrong patience. The trader keeps the faith and waits for days for the glorious days. And nothing happens.
I believe with this indicator I am able to solve those problems most of the time.
mcbw_RSI_candlesAn RSI can have any input, but most commonly used is the closing price. I thought it would be interesting to see if feeding the open high low and close information into the RSI to make RSI candles, if there are candlestick formations that can be recognized or possible patters in wicks.
To make it smoother there also is the option to turn the RSI candles into Heiken Ashi form, just check the box labeled HA. The result is an RSI that is easier on the eyes.
Happy trading!
Remember to not take everything too seriously

[RS]Heiken Ashi Cloud V2V2: switched hardcoded timeframes and place were bulls and bears take controll

Neural Network Buy and Sell SignalsTrend Architect Suite Lite - Neural Network Buy and Sell Signals
Advanced AI-Powered Signal Scoring
This indicator provides neural network market analysis on buy and sell signals designed for scalpers and day traders who use 30s to 5m charts. Signals are generated based on an ATR system and then filtered and scored using an advanced AI-driven system.
Features
Neural Network Signal Engine
5-Layer Deep Learning analysis combining market structure, momentum, and market state detection
AI-based Letter Grade Scoring (A+ through F) for instant signal quality assessment
Normalized Input Processing with Z-score standardization and outlier clipping
Real-time Signal Evaluation using 5 market dimensions
Advanced Candle Types
Standard Candlesticks - Raw price action
Heikin Ashi - Trend smoothing and noise reduction
Linear Regression - Mathematical trend visualization
Independent Signal vs Display - Calculate signals on one type, display another
Key Settings
Signal Configuration
- Signal Trigger Sensitivity (Default: 1.7) - Controls signal frequency vs quality
- Stop Loss ATR Multiplier (Default: 1.5) - Risk management sizing
- Signal Candle Type (Default: Candlesticks) - Data source for signal calculations
- Display Candle Type (Default: Linear Regression) - Visual candle display
Display Options
- Signal Distance (Default: 1.35 ATR) - Label positioning from price
- Label Size (Default: Medium) - Optimal readability
Trading Applications
Scalping
- Fast pace signal detection with quality filtering
- ATR-based stop management prevents signal overlap
- Neural network attempts to reduces false signals in choppy markets
Day Trading
- Multi-timeframe compatible with adaptation settings
- Clear trend visualization with Linear Regression candles
- Support/resistance integration for better entries/exits
Signal Filtering
- Use A+/A grades for highest probability setups
- B grades for confirmation in trending markets
- C-F grades help identify market uncertainty
Why Choose Trend Architect Lite?
No Lag - Real-time neural network processing
No Repainting - Signals appear and stay fixed
Clean Charts - Focus on price action, not indicators
Smart Filtering - AI reduces noise and false signals
Flexible and customizable - Works across all timeframes and instruments
Compatibility
- All Timeframes - 1m to Monthly charts
- All Instruments - Forex, Crypto, Stocks, Futures, Indices
Risk Disclaimer
This indicator is a tool for technical analysis and should not be used as the sole basis for trading decisions. Past performance does not guarantee future results. Always use proper risk management and never risk more than you can afford to lose.

MACD Liquidity Tracker Strategy [Quant Trading]MACD Liquidity Tracker Strategy
Overview
The MACD Liquidity Tracker Strategy is an enhanced trading system that transforms the traditional MACD indicator into a comprehensive momentum-based strategy with advanced visual signals and risk management. This strategy builds upon the original MACD Liquidity Tracker System indicator by TheNeWSystemLqtyTrckr , converting it into a fully automated trading strategy with improved parameters and additional features.
What Makes This Strategy Original
This strategy significantly enhances the basic MACD approach by introducing:
Four distinct system types for different market conditions and trading styles
Advanced color-coded histogram visualization with four dynamic colors showing momentum strength and direction
Integrated trend filtering using 9 different moving average types
Comprehensive risk management with customizable stop-loss and take-profit levels
Multiple alert systems for entry signals, exits, and trend conditions
Flexible signal display options with customizable entry markers
How It Works
Core MACD Calculation
The strategy uses a fully customizable MACD configuration with traditional default parameters:
Fast MA : 12 periods (customizable, minimum 1, no maximum limit)
Slow MA : 26 periods (customizable, minimum 1, no maximum limit)
Signal Line : 9 periods (customizable, now properly implemented and used)
Cryptocurrency Optimization : The strategy's flexible parameter system allows for significant optimization across different crypto assets. Traditional MACD settings (12/26/9) often generate excessive noise and false signals in volatile crypto markets. By using slower, more smoothed parameters, traders can capture meaningful momentum shifts while filtering out market noise.
Example - DOGE Optimization (45/80/290 settings) :
• Performance : Optimized parameters yielding exceptional backtesting results with 29,800% PnL
• Why it works : DOGE's high volatility and social sentiment-driven price action benefits from heavily smoothed indicators
• Timeframes : Particularly effective on 30-minute and 4-hour charts for swing trading
• Logic : The very slow parameters filter out noise and capture only the most significant trend changes
Other Optimizable Cryptocurrencies : This parameter flexibility makes the strategy highly effective for major altcoins including SUI, SEI, LINK, Solana (SOL) , and many others. Each crypto asset can benefit from custom parameter tuning based on its unique volatility profile and trading characteristics.
Four Trading System Types
1. Normal System (Default)
Long signals : When MACD line is above the signal line
Short signals : When MACD line is below the signal line
Best for : Swing trading and capturing longer-term trends in stable markets
Logic : Traditional MACD crossover approach using the signal line
2. Fast System
Long signals : Bright Blue OR Dark Magenta (transparent) histogram colors
Short signals : Dark Blue (transparent) OR Bright Magenta histogram colors
Best for : Scalping and high-volatility markets (crypto, forex)
Logic : Leverages early momentum shifts based on histogram color changes
3. Safe System
Long signals : Only Bright Blue histogram color (strongest bullish momentum)
Short signals : All other colors (Dark Blue, Bright Magenta, Dark Magenta)
Best for : Risk-averse traders and choppy markets
Logic : Prioritizes only the strongest bullish signals while treating everything else as bearish
4. Crossover System
Long signals : MACD line crosses above signal line
Short signals : MACD line crosses below signal line
Best for : Precise timing entries with traditional MACD methodology
Logic : Pure crossover signals for more precise entry timing
Color-Coded Histogram Logic
The strategy uses four distinct colors to visualize momentum:
🔹 Bright Blue : MACD > 0 and rising (strong bullish momentum)
🔹 Dark Blue (Transparent) : MACD > 0 but falling (weakening bullish momentum)
🔹 Bright Magenta : MACD < 0 and falling (strong bearish momentum)
🔹 Dark Magenta (Transparent) : MACD < 0 but rising (weakening bearish momentum)
Trend Filter Integration
The strategy includes an advanced trend filter using 9 different moving average types:
SMA (Simple Moving Average)
EMA (Exponential Moving Average) - Default
WMA (Weighted Moving Average)
HMA (Hull Moving Average)
RMA (Running Moving Average)
LSMA (Least Squares Moving Average)
DEMA (Double Exponential Moving Average)
TEMA (Triple Exponential Moving Average)
VIDYA (Variable Index Dynamic Average)
Default Settings : 50-period EMA for trend identification
Visual Signal System
Entry Markers : Blue triangles (▲) below candles for long entries, Magenta triangles (▼) above candles for short entries
Candle Coloring : Price candles change color based on active signals (Blue = Long, Magenta = Short)
Signal Text : Optional "Long" or "Short" text inside entry triangles (toggleable)
Trend MA : Gray line plotted on main chart for trend reference
Parameter Optimization Examples
DOGE Trading Success (Optimized Parameters) :
Using 45/80/290 MACD settings with 50-period EMA trend filter has shown exceptional results on DOGE:
Performance : Backtesting results showing 29,800% PnL demonstrate the power of proper parameter optimization
Reasoning : DOGE's meme-driven volatility and social sentiment spikes create significant noise with traditional MACD settings
Solution : Very slow parameters (45/80/290) filter out social media-driven price spikes while capturing only major momentum shifts
Optimal Timeframes : 30-minute and 4-hour charts for swing trading opportunities
Result : Exceptionally clean signals with minimal false entries during DOGE's characteristic pump-and-dump cycles
Multi-Crypto Adaptability :
The same optimization principles apply to other major cryptocurrencies:
SUI : Benefits from smoothed parameters due to newer coin volatility patterns
SEI : Requires adjustment for its unique DeFi-related price movements
LINK : Oracle news events create price spikes that benefit from noise filtering
Solana (SOL) : Network congestion events and ecosystem developments need smoothed detection
General Rule : Higher volatility coins typically benefit from very slow MACD parameters (40-50 / 70-90 / 250-300 ranges)
Key Input Parameters
System Type : Choose between Fast, Normal, Safe, or Crossover (Default: Normal)
MACD Fast MA : 12 periods default (no maximum limit, consider 40-50 for crypto optimization)
MACD Slow MA : 26 periods default (no maximum limit, consider 70-90 for crypto optimization)
MACD Signal MA : 9 periods default (now properly utilized, consider 250-300 for crypto optimization)
Trend MA Type : EMA default (9 options available)
Trend MA Length : 50 periods default (no maximum limit)
Signal Display : Both, Long Only, Short Only, or None
Show Signal Text : True/False toggle for entry marker text
Trading Applications
Recommended Use Cases
Momentum Trading : Capitalize on strong directional moves using the color-coded system
Trend Following : Combine MACD signals with trend MA filter for higher probability trades
Scalping : Use "Fast" system type for quick entries in volatile markets
Swing Trading : Use "Normal" or "Safe" system types for longer-term positions
Cryptocurrency Trading : Optimize parameters for individual crypto assets (e.g., 45/80/290 for DOGE, custom settings for SUI, SEI, LINK, SOL)
Market Suitability
Volatile Markets : Forex, crypto, indices (recommend "Fast" system or smoothed parameters)
Stable Markets : Stocks, ETFs (recommend "Normal" or "Safe" system)
All Timeframes : Effective from 1-minute charts to daily charts
Crypto Optimization : Each major cryptocurrency (DOGE, SUI, SEI, LINK, SOL, etc.) can benefit from custom parameter tuning. Consider slower MACD parameters for noise reduction in volatile crypto markets
Alert System
The strategy provides comprehensive alerts for:
Entry Signals : Long and short entry triangle appearances
Exit Signals : Position exit notifications
Color Changes : Individual histogram color alerts
Trend Conditions : Price above/below trend MA alerts
Strategy Parameters
Default Settings
Initial Capital : $1,000
Position Size : 100% of equity
Commission : 0.1%
Slippage : 3 points
Date Range : January 1, 2018 to December 31, 2069
Risk Management (Optional)
Stop Loss : Disabled by default (customizable percentage-based)
Take Profit : Disabled by default (customizable percentage-based)
Short Trades : Disabled by default (can be enabled)
Important Notes and Limitations
Backtesting Considerations
Uses realistic commission (0.1%) and slippage (3 points)
Default position sizing uses 100% equity - adjust based on risk tolerance
Stop-loss and take-profit are disabled by default to show raw strategy performance
Strategy does not use lookahead bias or future data
Risk Warnings
Past performance does not guarantee future results
MACD-based strategies may produce false signals in ranging markets
Consider combining with additional confluences like support/resistance levels
Test thoroughly on demo accounts before live trading
Adjust position sizing based on your risk management requirements
Technical Limitations
Strategy does not work on non-standard chart types (Heikin Ashi, Renko, etc.)
Signals are based on close prices and may not reflect intraday price action
Multiple rapid signals in volatile conditions may result in overtrading
Credits and Attribution
This strategy is based on the original "MACD Liquidity Tracker System" indicator created by TheNeWSystemLqtyTrckr . This strategy version includes significant enhancements:
Complete strategy implementation with entry/exit logic
Addition of the "Crossover" system type
Proper implementation and utilization of the MACD signal line
Enhanced risk management features
Improved parameter flexibility with no artificial maximum limits
Additional alert systems for comprehensive trade management
The original indicator's core color logic and visual system have been preserved while expanding functionality for automated trading applications.

PCR tableOverview
This indicator displays a multi-period table of forward-looking price projections. It combines normalized directional momentum (Positive Change Ratio, PCR) with volatility (ATR) and presents a forecast for upcoming time intervals, adjusted for your local UTC offset.
Concepts & Calculations
Positive Change Ratio (PCR):
((total positive change)/(total change)-0.5)*2, producing a value between –100 and +100.
Synthetic ATR: Calculates average true range over the same lookbacks to capture volatility.
PCR × ATR: Forms a volatility-weighted directional forecast, indicating expected move magnitude.
Future Price Projection: Adds PCR × ATR value to current close to estimate future price at each lookahead interval.
Table Layout
There are 12 forecast horizons—1× to 12× the chart timeframe (e.g., minutes, hours, days). Each row displays:
1. Future Time: Timestamp of each projection (adjustable via UTC offset)
2. PCR: Directional bias per period (–1 to +1)
3. PCR × ATR: E xpected move magnitude
4. Future Price: Close + (PCR × ATR)
High and low PCR×ATR rows are highlighted green for minimum value in the price forecast (buy signal) or red for maximum value in the price forecast (sell signal).
How to Use
1. Set UTC offset to your time zone for accurate future timestamps.
2. View PCR to assess bullish (positive) or bearish (negative) momentum.
3. Use PCR × ATR to estimate move strength and direction.
4. Reference Future Price for potential levels over upcoming intervals, and for buy and sell signals.
Limitations & Disclaimers
* This model uses linear extrapolation based on recent price behavior. It does not guarantee future prices.
* It uses only current bar data and no lookahead logic—compliant with Pine Script rules.
* Designed for analytical insight, not as an automated signal or trade executor.
* Best used on standard bar/candle charts (avoid non-standard types like Heikin‑Ashi or Renko).

UT Bot + LinReg Candles (Dual Sensitivity)
Script Description:
This indicator combines the popular UT Bot Alerts system with Linear Regression Candles (open source) for enhanced trend detection and trading signals in one singel script. The UT Bot features independent, then 2 x ATR sensitivity and periods controls for buy and sell signals, allowing you to fine-tune entries and exits to match your strategy. The script also overlays colored Linear Regression Candles with an optional signal line, helping you visually identify trend strength and direction. All calculations are performed on standard chart prices (no Heikin Ashi). Suitable for all asset classes and timeframes.
Eample setting for usdjpy 5 min chart for repeated buy and sell singnals based on trend:
BUY ATR period 300 multiplier 1
SELL ATR period 1 multiplier 2
Disclaimer:
This script is for informational and educational purposes only. It is not financial advice. Use at your own risk; the author assumes no responsibility for any trading results or losses.
Credits goes to to Ugurvu for linreg candles and quantnomad for UT Bot alerts that make this script possible.
Author: Patrick

Candle Count RSI📈 Candle Count RSI — A Dual-Perspective Momentum Engine
The Candle Count RSI is a custom-built momentum oscillator that expands on the classic Relative Strength Index (RSI) by introducing a directional-only variant that tracks the frequency of bullish or bearish closes, rather than price magnitude. It gives traders a second lens through which to evaluate momentum, trend conviction, and subtle divergences—often invisible to traditional price-based RSI.
💡 What Makes It Unique?
While the standard RSI is sensitive to the size of price changes, the Candle Count RSI is magnitude-blind. It counts candle closes above/below open over a lookback period, generating a purer signal of directional consistency. To enhance signal fidelity, it includes a streak amplifier, dynamically weighting extended runs of green or red candles to reflect intensity of market bias—without introducing artificial price sensitivity.
This dual-RSI approach allows for:
- Divergence detection between directional bias and price magnitude.
- Smoother trend confirmation in choppy markets.
- Cleaner visual cues using dynamic glow and background logic.
📐 How Standard RSI Actually Works (Not What You Think)
RSI doesn’t just check if price went up or down over a span—it checks each individual candle and tracks whether it closed higher or lower than the one before. Here's how it works under the hood:
1.) For each bar, it calculates the change from the previous close.
2.) It separates those changes into gains (upward moves) and losses (downward moves).
3.) Then it computes a smoothed average of those gains and losses (usually using an RMA).
4.) It calculates the Relative Strength (RS) as:
RS = AvgGain / AvgLoss
5.) Finally, it plugs that into the RSI formula:
RSI = 100 - (100 / (1 + RS))
⚖️ What Does the 50 Line Mean?
- The RSI scale runs from 0 to 100, but 50 is the true neutral zone:
- RSI > 50 means average gains outweigh average losses over the period.
- RSI < 50 means losses dominate.
- RSI ≈ 50? The market is balanced—momentum is indecisive, no clear trend bias.
- This makes 50 a powerful midline for trend filters, directional bias tools, and divergence detection—especially when paired with alternative RSI logic like Candle Count RSI.
🔧 Inputs and Customization
- Everything is fully modular and customizable:
🧠 Core Settings
- RSI Length: Used for both the standard RSI and Candle Count RSI.
📉 Standard RSI
- Classic RSI calculation based on price changes.
- Optional WMA smoothing to reduce noise.
- Glow effect toggle with custom intensity.
🕯 Candle Count RSI
- Computes RSI using only the count of up/down candles.
- Optional smoothing for stability.
- Amplifies streaks (e.g., multiple consecutive bullish candles increase strength).
- Glow effect toggle with adjustable strength.
🎇 Glow Visuals
- Background glow (subpane and/or main chart).
- Fades based on RSI distance from the 50 midpoint.
- Independent color settings for bull and bear bias.
🧬 Divergence Zones
- Detects when Candle RSI and Standard RSI diverge.
- Highlights:
- Bullish Divergence: Candle RSI > 50, Standard RSI < threshold.
- Bearish Divergence: Candle RSI < 50, Standard RSI > threshold.
- Background fill optionally shown in subpane and/or main chart.
📊 Directional Histogram
- MACD-style histogram showing the difference between the two RSI lines.
- Color-coded based on directional agreement:
- Both rising → green.
- Both falling → red.
- Conflict → yellow.
🧠 Under the Hood — How It Works
🔹 Standard RSI
- Classic ta.rsi() applied to close prices, optionally WMA-smoothed.
🔹 Candle Count RSI (CCR)
- Counts how many candles closed up/down over the period.
- Computes a magnitude-free RSI from these counts.
- Applies a streak-based multiplier to exaggerate trend strength during consecutive green/red runs.
- Optionally smoothed with WMA to create a clean signal line.
- This makes CCR ideal for detecting true directional bias without being faked out by volatile price spikes.
🔹 Divergence Logic
- When Candle RSI and Standard RSI disagree strongly across defined thresholds, background fills highlight early signs of momentum decay or hidden accumulation/distribution.
🔹 Glow Logic
- Glow zones are controlled by a master toggle and drawn with dynamic transparency:
- Further from 50 = stronger conviction = darker glow.
- Shows up in subpane and/or main chart depending on user preference.
📷 Suggested Use Case / Visual Setup
- Use in conjunction with your primary price action system.
- Watch for divergences between the Candle Count RSI and Standard RSI for early trend reversals.
- Use glow bias zones on the main chart to get subconscious directional cues during fast scalping.
- Histogram helps you confirm when both RSI variants agree—useful during strong trending conditions.
🛠️ Tip for Traders
- This tool isn’t trying to “predict” price. It’s designed to visualize hidden market psychology—when buyers are showing up with consistent pressure, or when momentum has a disconnect between conviction and magnitude. Use this to filter entries, spot weak rallies, or sense when a trend is about to break down.
⚠️ WARNING
- Not for use with Heikin Ashi, Renko, etc.).
🧠 Summary
Candle Count RSI is not just another mashup—it's a precision-built, dual-perspective oscillator that captures directional conviction using real candle behavior. Whether you're scalping intraday or swing trading momentum, this script helps clarify trend integrity and exposes hidden weaknesses with elegance and clarity.
—
🛠️ Built by: Sherlock_MacGyver
Feel free to share feedback or reach out if you'd like to collaborate on custom features.

Support and Resistance MTFSupport and Resistance MTF
Support and Resistance MTF is a powerful tool that automatically detects and visualizes key support and resistance levels based on pivot highs and lows, using a higher timeframe of your choice. It is designed for traders who focus on price action and market structure, and want an adaptive, clean, and customizable indicator that helps identify important market zones.
The script uses configurable pivot logic to identify levels, with user-defined parameters for pivot strength and timeframe. Once a support or resistance level is detected, it is displayed on the chart either as a horizontal line, a shaded box, or both, depending on your display settings. You can fully customize the visual appearance including color, transparency, and line thickness. Levels are automatically extended into the future, and optionally into the past, to give better context.
Each level is monitored for breakout behavior. If price breaks through a level, it can change its role — a former resistance may become support, and vice versa. After a certain number of breakouts (which you define), the level is considered invalid and is automatically removed from the chart. This helps to maintain a clean visual layout and ensures only relevant levels are shown.
The indicator supports multi-timeframe analysis, allowing you to overlay higher-timeframe structure directly on your lower-timeframe trading chart. It is also compatible with Heikin Ashi candles internally for reference, without affecting your main chart type.
Support and Resistance MTF is ideal for traders looking to align intraday setups with higher-timeframe zones, manage risk around structural levels, or simply highlight market turning points in a clear and automated way. Built with Pine Script v5 and optimized for performance, it is both powerful and lightweight.
⚙️ Input Parameters – Description
[Time-Frame
Defines the higher timeframe used for detecting support and resistance levels. For example, you can set this to 1h, 4h, or D to visualize significant levels from a broader market perspective on a lower-timeframe chart.
Left / Right (Pivot Left / Pivot Right)
These parameters control the sensitivity of the pivot detection. A pivot high/low is confirmed if it is higher/lower than the defined number of candles to its left and right. Higher values reduce noise but may miss smaller turning points.
Extend Left
When enabled, the drawn levels (lines and/or boxes) are extended to the left side of the chart, allowing you to see the historical alignment of these levels.
Max Breaks Before Delete
Defines how many times a level can be broken by price before it is removed from the chart. This helps to avoid clutter from outdated or invalidated levels and keeps your chart relevant to current price action.
Draw Lines Only
If enabled, the indicator will draw only horizontal lines for support and resistance zones, omitting the colored background boxes. Useful for a cleaner chart appearance.
Line Width Broken Level
Sets the thickness of the support/resistance lines. Thicker lines can emphasize key levels, especially after a breakout.
Transparency Boxes
Controls the transparency (0–100) of the background boxes representing the zones. A higher value makes the boxes more transparent, lower values make them more opaque.
Transparency Lines
Controls the transparency (0–100) of the horizontal support and resistance lines. This allows for visual fine-tuning based on chart background and personal preference.
Support (Color, Group: Display)
Lets you choose the color used for support zones and lines. By default, it's green, but you can change it to fit your theme or visual preference.
Resistance (Color, Group: Display)
Defines the color for resistance zones and lines. The default is red, but it can be customized freely.
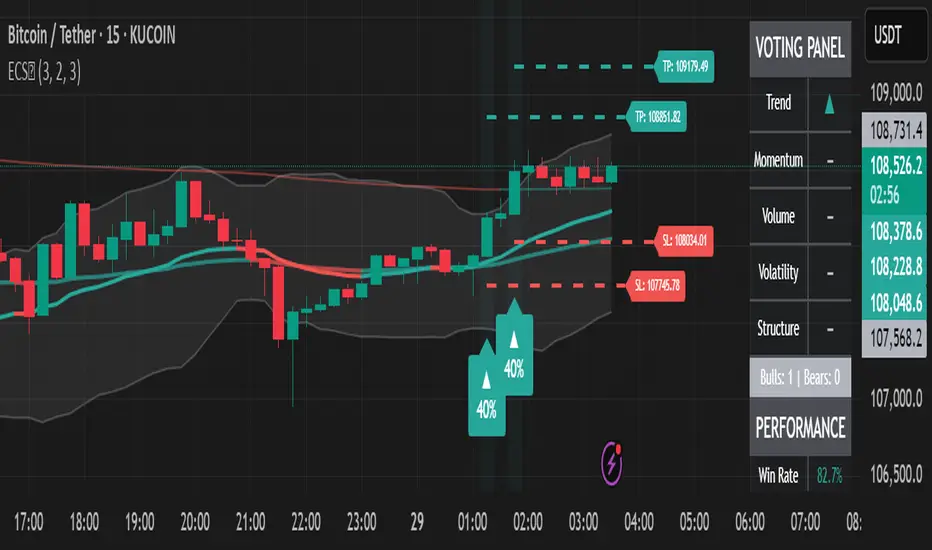
Ensemble Consensus System
The Ensemble Consensus System (ECS) brings a **Random Forest-style ensemble vote** to Pine Script: five orthogonal "expert" strategies each cast a bull/bear vote (+1/-1/0), and only high-confidence consensus moves become signals—dramatically reducing noise while capturing strong directional moves.
## What Makes This Original
ECS is the first Pine Script indicator to implement true machine learning-style ensemble voting. Rather than relying on a single methodology, five independent experts analyze different market dimensions:
• **Trend Expert**: Multi-timeframe EMA alignment analysis
• **Momentum Expert**: RSI/MACD/Stochastic confluence with consistency filters
• **Volume Expert**: Proprietary volume pressure + OBV confirmation
• **Volatility Expert**: Bollinger Band mean reversion opportunities
• **Structure Expert**: Adaptive pivot-based support/resistance detection
## How It Works
The system requires consensus among experts, with an **adaptive threshold** based on market volatility:
| Volatility Regime | ATR/Close | Votes Required |
|-------------------|-----------|----------------|
| Low Volatility | <1% | 2+ |
| Normal Markets | 1-2% | 3+ |
| High Volatility | >2% | 4+ |
This dynamic adjustment prevents overtrading in choppy conditions while maintaining responsiveness during strong trends.
## Key Features
### Signals
• **Visual entry points** with strength percentage (60% = 3/5 experts agree)
• **Adaptive thresholds** that adjust to market conditions
• **Multi-expert consensus** reduces false signals
### Risk Control
• **Dynamic stop-loss/take-profit** based on ATR
• **Regime-adjusted targets** (±50% in volatile markets)
• **Visual SL/TP lines** with exact price labels
### Analytics
• **Real-time vote panel** showing each expert's stance
• **Performance tracking** with win rate and P/L
• **Market regime indicator** (Trending/Ranging/Volatile)
• **Light Mode** for better performance on slower systems
## How to Use
1. **Apply ECS** to a liquid instrument on 15m-4H timeframe (best: 1H)
2. **Wait for signal** - green ▲ for long, red ▼ for short with strength %
3. **Verify votes** - check panel to see which experts agree
4. **Execute trade** using the displayed SL/TP levels
5. **Monitor regime** - be cautious if market regime changes
### Quick Start Settings
• **Standard Trading**: Use defaults (3 votes, adaptive mode ON)
• **Conservative**: Increase to 4 votes minimum
• **Aggressive**: Reduce to 2 votes, tighten stops
## Important Limitations
• **Chart Types**: Not compatible with Renko/Heikin-Ashi
• **Volume Data**: Requires reliable volume (forex pairs may underperform)
• **News Events**: Signals may lag during gaps/major announcements
• **Processing**: Heavy calculations - use Light Mode if needed
## Settings Guide
**Ensemble Controls**
• `Minimum Votes` (default: 3): Base threshold before volatility adjustment
• `Adaptive Mode` (default: ON): Auto-adjusts threshold by market volatility
**Visual Options**
• `Vote Panel`: Live expert voting display
• `Performance Stats`: Win rate and trade tracking
• `Light Mode`: Disables heavy visuals for speed
**Risk Parameters**
• `Stop Multiplier` (default: 2.0): ATR multiple for stop-loss
• `TP Multiplier` (default: 3.0): ATR multiple for take-profit
• `Dynamic TP` (default: ON): Adjusts targets by market regime
## Troubleshooting
**Too few signals?**
→ Lower minimum votes or check if market is ranging
**Indicator running slow?**
→ Enable Light Mode, disable performance tracking
**Weird volume votes?**
→ Verify your symbol has accurate volume data
## Technical Concepts
The ensemble approach mimics **Random Forest algorithms** where multiple decision trees vote on outcomes. By requiring agreement among experts using orthogonal methodologies, ECS filters out signals that would fail under different market lenses. The adaptive threshold addresses fixed-parameter weakness by dynamically adjusting selectivity based on volatility.
• Adaptive pivot lookback for dynamic structure detection
• Safe volume pressure calculation preventing division errors
• Momentum consistency filter reducing choppy false signals
• Unified dashboard merging vote panel + performance stats
• Regime-based dynamic take-profit adjustment
*Educational indicator demonstrating ensemble methods in Pine Script. No guarantee of future performance. Always use proper risk management and position sizing.*
BVB dominance bars
Hello everyone, this is my first indicator. these candles shows you who's in control. I like to think its some what close to heikin ashi candles as it shows you the Trend but doesn't average it out. also shows you when there is indecision. please read the instructions on how it works. its not a stand alone strategy. but adds value to your own strategy.
📖 How It Works
The BvB Dominance Bars indicator is a visual tool that colors candles based on market control—whether bulls or bears are in charge. It uses a custom metric comparing the price's relationship to a smoothed moving average (EMA), then normalizes that difference over time to express relative bullish or bearish pressure.
Here’s the breakdown:
Bulls vs Bears Logic:
A short-term EMA (default: 14-period) is used to establish a midpoint reference.
Bull Pressure is calculated as how far the high is above this EMA.
Bear Pressure is how far the low is below this EMA.
These are normalized over a lookback period (default: 120 bars) to produce percentile scores (0–100) for both bulls and bears.
Dominance & Color Coding:
The indicator compares normalized bull and bear scores.
Candles are color-coded based on:
Bright Lime: Strong Bull Dominance (with high confidence)
Soft Lime/Yellow: Moderate Bull Control
Bright Red: Strong Bear Dominance
Soft Red/Yellow: Moderate Bear Control
Gray: Neutral/Low conviction
Optional Live Label:
A small floating label shows who has control: “Bull Control,” “Bear Control,” or “Neutral.”
🧠 How to Use It (Example Strategy)
The BvB Dominance Bars indicator is not a standalone buy/sell signal but a market sentiment overlay. It’s most effective when combined with your own strategy, like price action or trend-following tools.
Here’s an example use case:
🧪 Reversal Confirmation Strategy
Objective: Catch high-probability reversals during key kill zones or supply/demand levels.
Setup:
Mark your key support/resistance zones using your standard method (e.g., FVGs, liquidity sweeps, or ICT PD arrays).
Wait for price to reach one of these zones.
Watch candle colors from the BvB Dominance Bars:
If you expect a bullish reversal, wait for a transition from red/gray candles to lime green or bright lime (bullish dominance taking over).
If you expect a bearish reversal, look for a change from green/gray to red or bright red.
Entry Filter:
Only enter if the dominant color holds for 2+ candles.
Avoid trades when candles are gray or yellow (indecision/neutral).
Exit Option:
Exit if dominance shifts against you (e.g., from lime to red), or use structure-based stops.
⚙️ Settings You Can Adjust:
BvB Period: Controls how fast EMA responds.
Bars Back: Determines how long the normalization looks back.
Thresholds: Influence how strong the dominance must be to change candle color.
✅ Best Used When:
You already have a bias and just want a confirmation of sentiment.
You're trading intraday and want a feel for shifting momentum without relying on noisy indicators.
You want a clean, color-coded overlay to help filter out fakeouts and indecision.

Bollinger Bands ETSOverview
Bollinger Bands ETstyle (BB ETS) is an advanced volatility and breakout detection indicator, building upon the classic Bollinger Bands. This script introduces adaptive ATR-based band width smoothing and clear squeeze detection, making it a versatile tool for traders seeking more responsive and actionable volatility analysis.
Features
Dual Bollinger Bands: Plots both standard and outer bands around a configurable moving average, allowing visualization of typical and extreme volatility ranges.
ATR-Based Band Smoothing (Optional): When enabled, the bands automatically widen during low-volatility periods using the Average True Range (ATR), reducing false signals and making the bands more adaptive.
Squeeze Detection (Optional): Highlights periods when the bands contract below a user-defined threshold, signaling potential breakout setups. Squeeze periods are visually marked with a background highlight for easy identification.
Customizable Settings: Users can adjust band length, standard deviation multipliers, ATR parameters, and squeeze thresholds. Both ATR smoothing and squeeze detection can be toggled on or off.
Clean Chart Output: The indicator overlays directly on price with clear, distinguishable visuals for all features.
How It Works
The indicator calculates a moving average (basis) and plots upper and lower bands at user-selected standard deviations.
If ATR smoothing is enabled, the band width expands by a multiple of the ATR, adapting to real-time volatility.
The script computes the relative band width ("bandwidth"). When this falls below your chosen threshold, the background is highlighted to indicate a "squeeze"-a period of reduced volatility that often precedes breakouts.
How to Use
Trend & Volatility Analysis: Use the bands to identify overbought/oversold conditions and current market volatility. Price touching or crossing the outer bands may signal trend exhaustion or continuation.
Breakout Anticipation: Watch for background highlights indicating a squeeze. These periods suggest the market is coiling for a potential significant move.
Adaptive Sensitivity: Enable ATR smoothing to keep bands relevant during both calm and volatile markets, reducing false signals in low-volatility conditions.
Customization: Adjust all parameters in the settings to match your trading style and the asset’s behavior.
Limitations
The indicator is designed for standard price charts and may not perform as intended on non-standard chart types (such as Renko or Heikin Ashi).
As with all technical tools, best results are achieved when used alongside other forms of analysis.
Summary
Bollinger Bands ETstyle (BB ETS) offers a modern, adaptive approach to volatility and breakout analysis by combining classic bands with ATR-based smoothing and clear squeeze visualization. It is suitable for trend-following and breakout strategies, and requires no additional scripts-simply apply to your chart and adjust the settings as needed.

C&B Auto MK5C&B Auto MK5.2ema BullBear
Overview
The C&B Auto MK5.2ema BullBear is a versatile Pine Script indicator designed to help traders identify bullish and bearish market conditions across various timeframes. It combines Exponential Moving Averages (EMAs), Relative Strength Index (RSI), Average True Range (ATR), and customizable time filters to generate actionable signals. The indicator overlays on the price chart, displaying EMAs, a dynamic cloud, scaled RSI levels, bull/bear signals, and market condition labels, making it suitable for swing trading, day trading, or scalping in trending or volatile markets.
What It Does
This indicator generates bull and bear signals based on the interaction of two EMAs, filtered by RSI thresholds, ATR-based volatility, a 50/200 EMA trend filter, and user-defined time windows. It adapts to market volatility by adjusting EMA lengths and RSI thresholds. A dynamic cloud highlights trend direction or neutral zones, with candlestick coloring in neutral conditions. Market condition labels (current and historical) provide real-time trend and volatility context, displayed above the chart.
How It Works
The indicator uses the following components:
EMAs: Two EMAs (short and long) are calculated on a user-selected timeframe (1, 5, 15, 30, or 60 minutes). Their crossover or crossunder triggers potential bull/bear signals. EMA lengths adjust based on volatility (e.g., 10/20 for volatile markets, 5/10 for non-volatile).
Dynamic Cloud: The area between the EMAs forms a cloud, colored green for bullish trends, red for bearish trends, or a user-defined color (default yellow) for neutral zones (when EMAs are close, determined by an ATR-based threshold). Users can widen the cloud for visibility.
RSI Filter: RSI is scaled to price levels and plotted on the chart (optional). Signals are filtered to ensure RSI is within volatility-adjusted bull/bear thresholds and not in overbought/oversold zones.
ATR Volatility Filter: An optional filter ensures signals occur during sufficient volatility (ATR(14) > SMA(ATR, 20)).
50/200 EMA Trend Filter: An optional filter restricts bull signals to bullish trends (50 EMA > 200 EMA) and bear signals to bearish trends (50 EMA < 200 EMA).
Time Filter: Signals are restricted to a user-defined UTC time window (default 9:00–15:00), aligning with active trading sessions.
Market Condition Labels: Labels above the chart display the current trend (Bullish, Bearish, Neutral) and optionally volatility (e.g., “Bullish Volatile”). Up to two historical labels persist for a user-defined number of bars (default 5) to show recent trend changes.
Visual Aids: Bull signals appear as green triangles/labels below the bar, bear signals as red triangles/labels above. Candlesticks in neutral zones are colored (default yellow).
The indicator ensures compatibility with standard chart types (e.g., candlestick or bar charts) to produce realistic signals, avoiding non-standard types like Heikin Ashi or Renko.
How to Use It
Add to Chart: Apply the indicator to a candlestick or bar chart on TradingView.
Configure Settings:
Timeframe: Choose a timeframe (1, 5, 15, 30, or 60 minutes) to match your trading style.
Filters:
Enable/disable the ATR volatility filter to focus on high-volatility periods.
Enable/disable the 50/200 EMA trend filter to align signals with the broader trend.
Enable the time filter and set custom UTC hours/minutes (default 9:00–15:00).
Cloud Settings: Adjust the cloud width, neutral zone threshold, color, and transparency.
EMA Colors: Use default trend-based colors or set custom colors for short/long EMAs.
RSI Display: Toggle the scaled RSI and its thresholds, with customizable colors.
Signal Settings: Toggle bull/bear labels and set signal colors.
Market Condition Labels: Toggle current/historical labels, include/exclude volatility, and adjust decay period.
Interpret Signals:
Bull Signal: A green triangle or “Bull” label below the bar indicates potential bullish momentum (EMA crossover, RSI above bull threshold, within time window, passing filters).
Bear Signal: A red triangle or “Bear” label above the bar indicates potential bearish momentum (EMA crossunder, RSI below bear threshold, within time window, passing filters).
Neutral Zone: Yellow candlesticks and cloud (if enabled) suggest a lack of clear trend; consider range-bound strategies or avoid trading.
Market Condition Labels: Check labels above the chart for real-time trend (Bullish, Bearish, Neutral) and volatility status to confirm market context.
Monitor Context: Use the cloud, RSI, and labels to assess trend strength and volatility before acting on signals.
Unique Features
Volatility-Adaptive EMAs: Automatically adjusts EMA lengths based on ATR to suit volatile or non-volatile markets, reducing manual configuration.
Neutral Zone Detection: Uses an ATR-based threshold to identify low-trend periods, helping traders avoid choppy markets.
Scaled RSI Visualization: Plots RSI and thresholds directly on the price chart, simplifying momentum analysis relative to price.
Flexible Time Filtering: Supports precise UTC-based trading windows, ideal for day traders targeting specific sessions.
Historical Market Labels: Displays recent trend changes (up to two) with a decay period, providing context for market shifts.
50/200 EMA Trend Filter: Aligns signals with the broader market trend, enhancing signal reliability.
Notes
Use on standard candlestick or bar charts to ensure accurate signals.
Test the indicator on a demo account to optimize settings for your market and timeframe.
Combine with other analysis (e.g., support/resistance, volume) for better decision-making.
The indicator is not a standalone system; use it as part of a broader trading strategy.
Limitations
Signals may lag in fast-moving markets due to EMA-based calculations.
Neutral zone detection may vary in extremely volatile or illiquid markets.
Time filters are UTC-based; ensure your platform’s timezone settings align.
This indicator is designed for traders seeking a customizable, trend-following tool that adapts to volatility and provides clear visual cues with robust filtering for bullish and bearish market conditions.

AlphaTrend++AlphaTrend++
Overview
The AlphaTrend++ is an advanced Pine Script indicator designed to help traders identify buy and sell opportunities in trending and volatile markets. Building on trend-following principles, it uses a modified Average True Range (ATR) calculation combined with volume or momentum data to plot a dynamic trend line. The indicator overlays on the price chart, displaying a colored trend line, a filled trend zone, buy/sell signals, and optional stop-loss tick labels, making it ideal for day trading or swing trading, particularly in markets like futures (e.g., MES).
What It Does
This indicator generates buy and sell signals based on the direction and momentum of a custom trend line, filtered by optional time restrictions and signal frequency logic. The trend line adapts to price action and volatility, with a filled zone highlighting trend strength. Buy/sell signals are plotted as labels, and stop-loss distances are displayed in ticks (customizable for instruments like MES). The indicator supports standard chart types for realistic signal generation.
How It Works
The indicator employs the following components:
Trend Line Calculation: A dynamic trend line is calculated using ATR adjusted by a user-defined multiplier, combined with either Money Flow Index (MFI) or Relative Strength Index (RSI) depending on volume availability. The line tracks price movements, adjusting upward or downward based on trend direction and volatility.
Trend Zone: The area between the current trend line and its value two bars prior is filled, colored green for bullish trends (upward movement) or red for bearish trends (downward movement), providing a visual cue of trend strength.
Signal Generation: Buy signals occur when the trend line crosses above its value two bars ago, and sell signals occur when it crosses below, with optional filtering to reduce signal noise (based on bar timing logic). Signals can be restricted to a 9:00–15:00 UTC trading window.
Stop-Loss Ticks: For each signal, the indicator calculates the distance to the trend line (acting as a stop-loss level) in ticks, using a user-defined tick size (default 0.25 for MES). These are displayed as labels below/above the signal.
Time Filter: An optional filter limits signals to 9:00–15:00 UTC, aligning with active trading sessions like the US market open.
The indicator ensures compatibility with standard chart types (e.g., candlestick or bar charts) to avoid unrealistic results associated with non-standard types like Heikin Ashi or Renko.
How to Use It
Add to Chart: Apply the indicator to a candlestick or bar chart on TradingView.
Configure Settings:
Multiplier: Adjust the ATR multiplier (default 1.0) to control trend line sensitivity. Higher values widen the stop-loss distance.
Common Period: Set the ATR and MFI/RSI period (default 14) for trend calculations.
No Volume Data: Enable if volume data is unavailable (e.g., for certain forex pairs), switching from MFI to RSI.
Tick Size: Set the tick size for stop-loss calculations (default 0.25 for MES futures).
Show Buy/Sell Signals: Toggle signal labels (default enabled).
Show Stop Loss Ticks: Toggle stop-loss tick labels (default enabled).
Use Time Filter: Restrict signals to 9:00–15:00 UTC (default disabled).
Use Filtered Signals: Enable to reduce signal frequency using bar timing logic (default enabled).
Interpret Signals:
Buy Signal: A blue “BUY” label below the bar indicates a potential long entry (trend line crossover, passing filters).
Sell Signal: A red “SELL” label above the bar indicates a potential short entry (trend line crossunder, passing filters).
Trend Zone: Green fill suggests bullish momentum; red fill suggests bearish momentum.
Stop-Loss Ticks: Gray labels show the stop-loss distance in ticks, helping with risk management.
Monitor Context: Use the trend line and filled zone to confirm the market’s direction before acting on signals.
Unique Features
Adaptive Trend Line: Combines ATR with MFI or RSI to create a responsive trend line that adjusts to volatility and market conditions.
Tick-Based Stop-Loss: Displays stop-loss distances in ticks, customizable for specific instruments, aiding precise risk management.
Signal Filtering: Optional bar timing logic reduces false signals, improving reliability in choppy markets.
Trend Zone Visualization: The filled zone between trend line values enhances trend clarity, making it easier to assess momentum.
Time-Restricted Trading: Optional 9:00–15:00 UTC filter aligns signals with high-liquidity sessions.
Notes
Use on standard candlestick or bar charts to ensure accurate signals.
Test the indicator on a demo account to optimize settings for your market and timeframe.
Combine with other analysis (e.g., support/resistance, volume spikes) for better decision-making.
The indicator is not a standalone system; use it as part of a broader trading strategy.
Limitations
Signals may lag in highly volatile or low-liquidity markets due to ATR-based calculations.
The 9:00–15:00 UTC time filter may not suit all markets; disable it for 24-hour assets like forex or crypto.
Stop-loss tick calculations assume consistent tick sizes; verify compatibility with your instrument.
This indicator is designed for traders seeking a robust, trend-following tool with customizable risk management and signal filtering, optimized for active trading sessions.
